Service Operations Planning
Public-safe materials only: figures are selected from project materials and model outputs without sensitive operations records.
Application Context
This applied case focuses on a public-service scenario where planning decisions must balance service quality, resource cost, and operational stability.
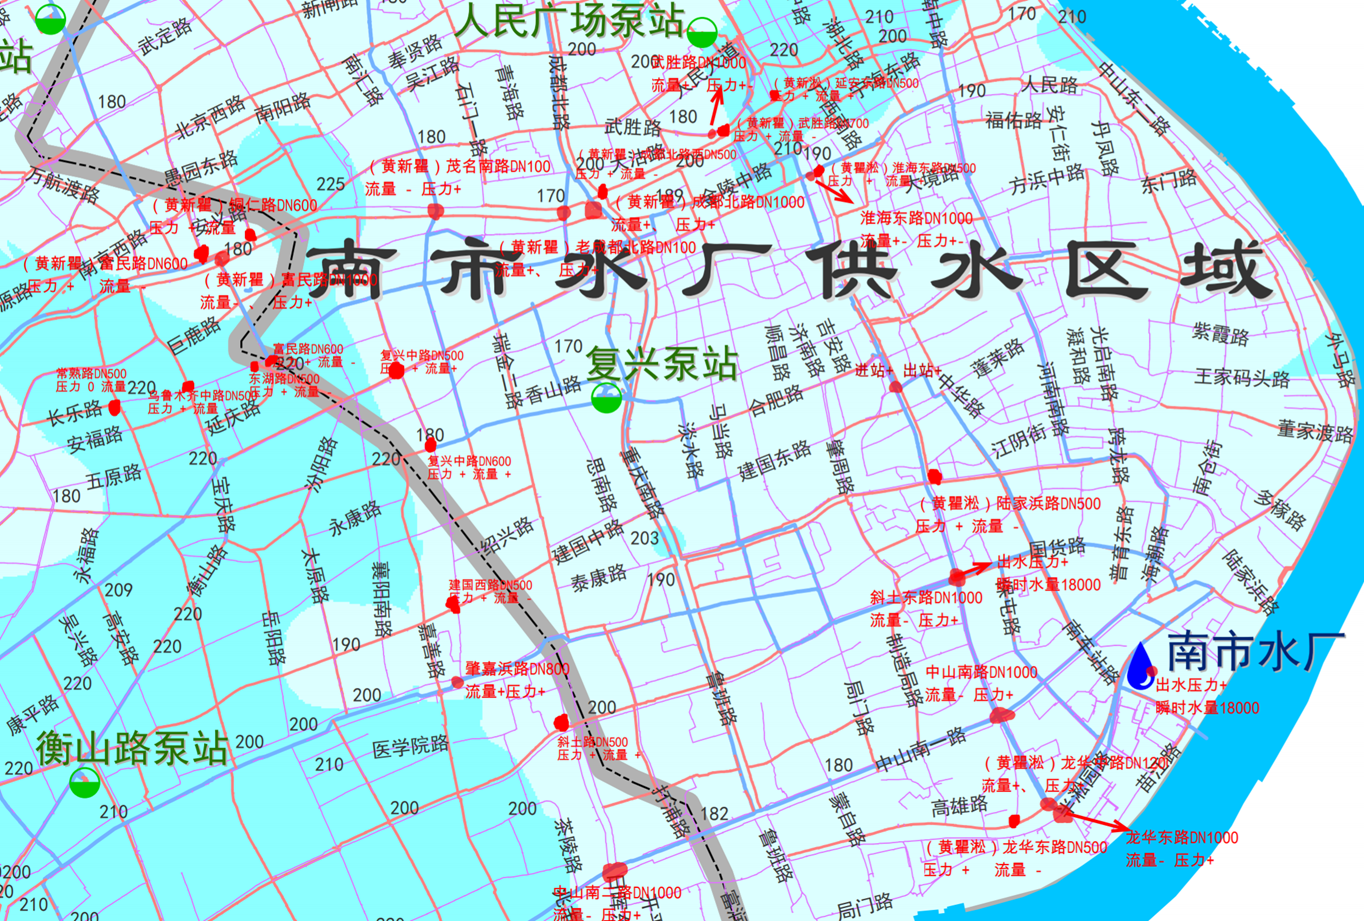
Representative service-area map for a public-service planning scenario.
中文图注:公共服务场景的示范区域示意图。
Workflow Overview
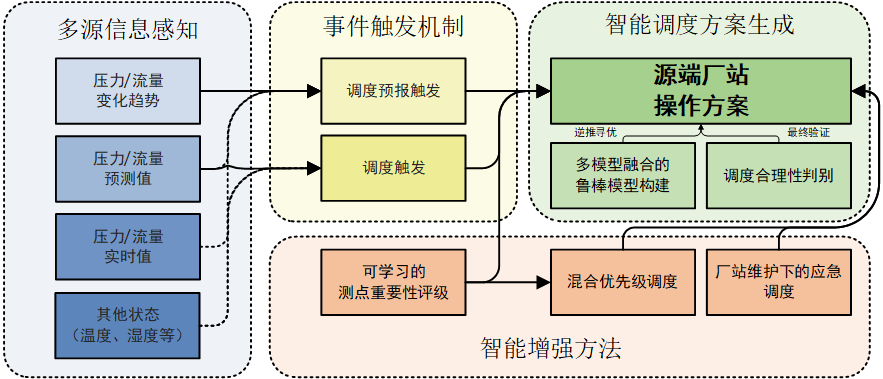
Workflow from multi-source inputs and event triggers to plan generation.
中文图注:多源输入、事件触发与方案生成的方法框架。
- Prediction and planning workflow connecting demand forecasting and routine decisions.
- Rule-aware planning with configurable settings.
- Integration with dashboard-based review and fallback options.
Forecasting Example
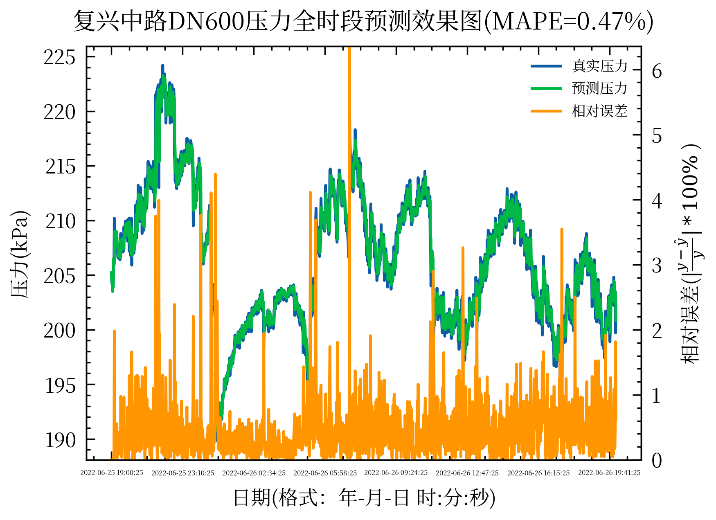
Forecasting example with low MAPE across the full study period.
中文图注:全时段预测示例图,图中保留 MAPE 指标作为结果摘要。
Review Interfaces
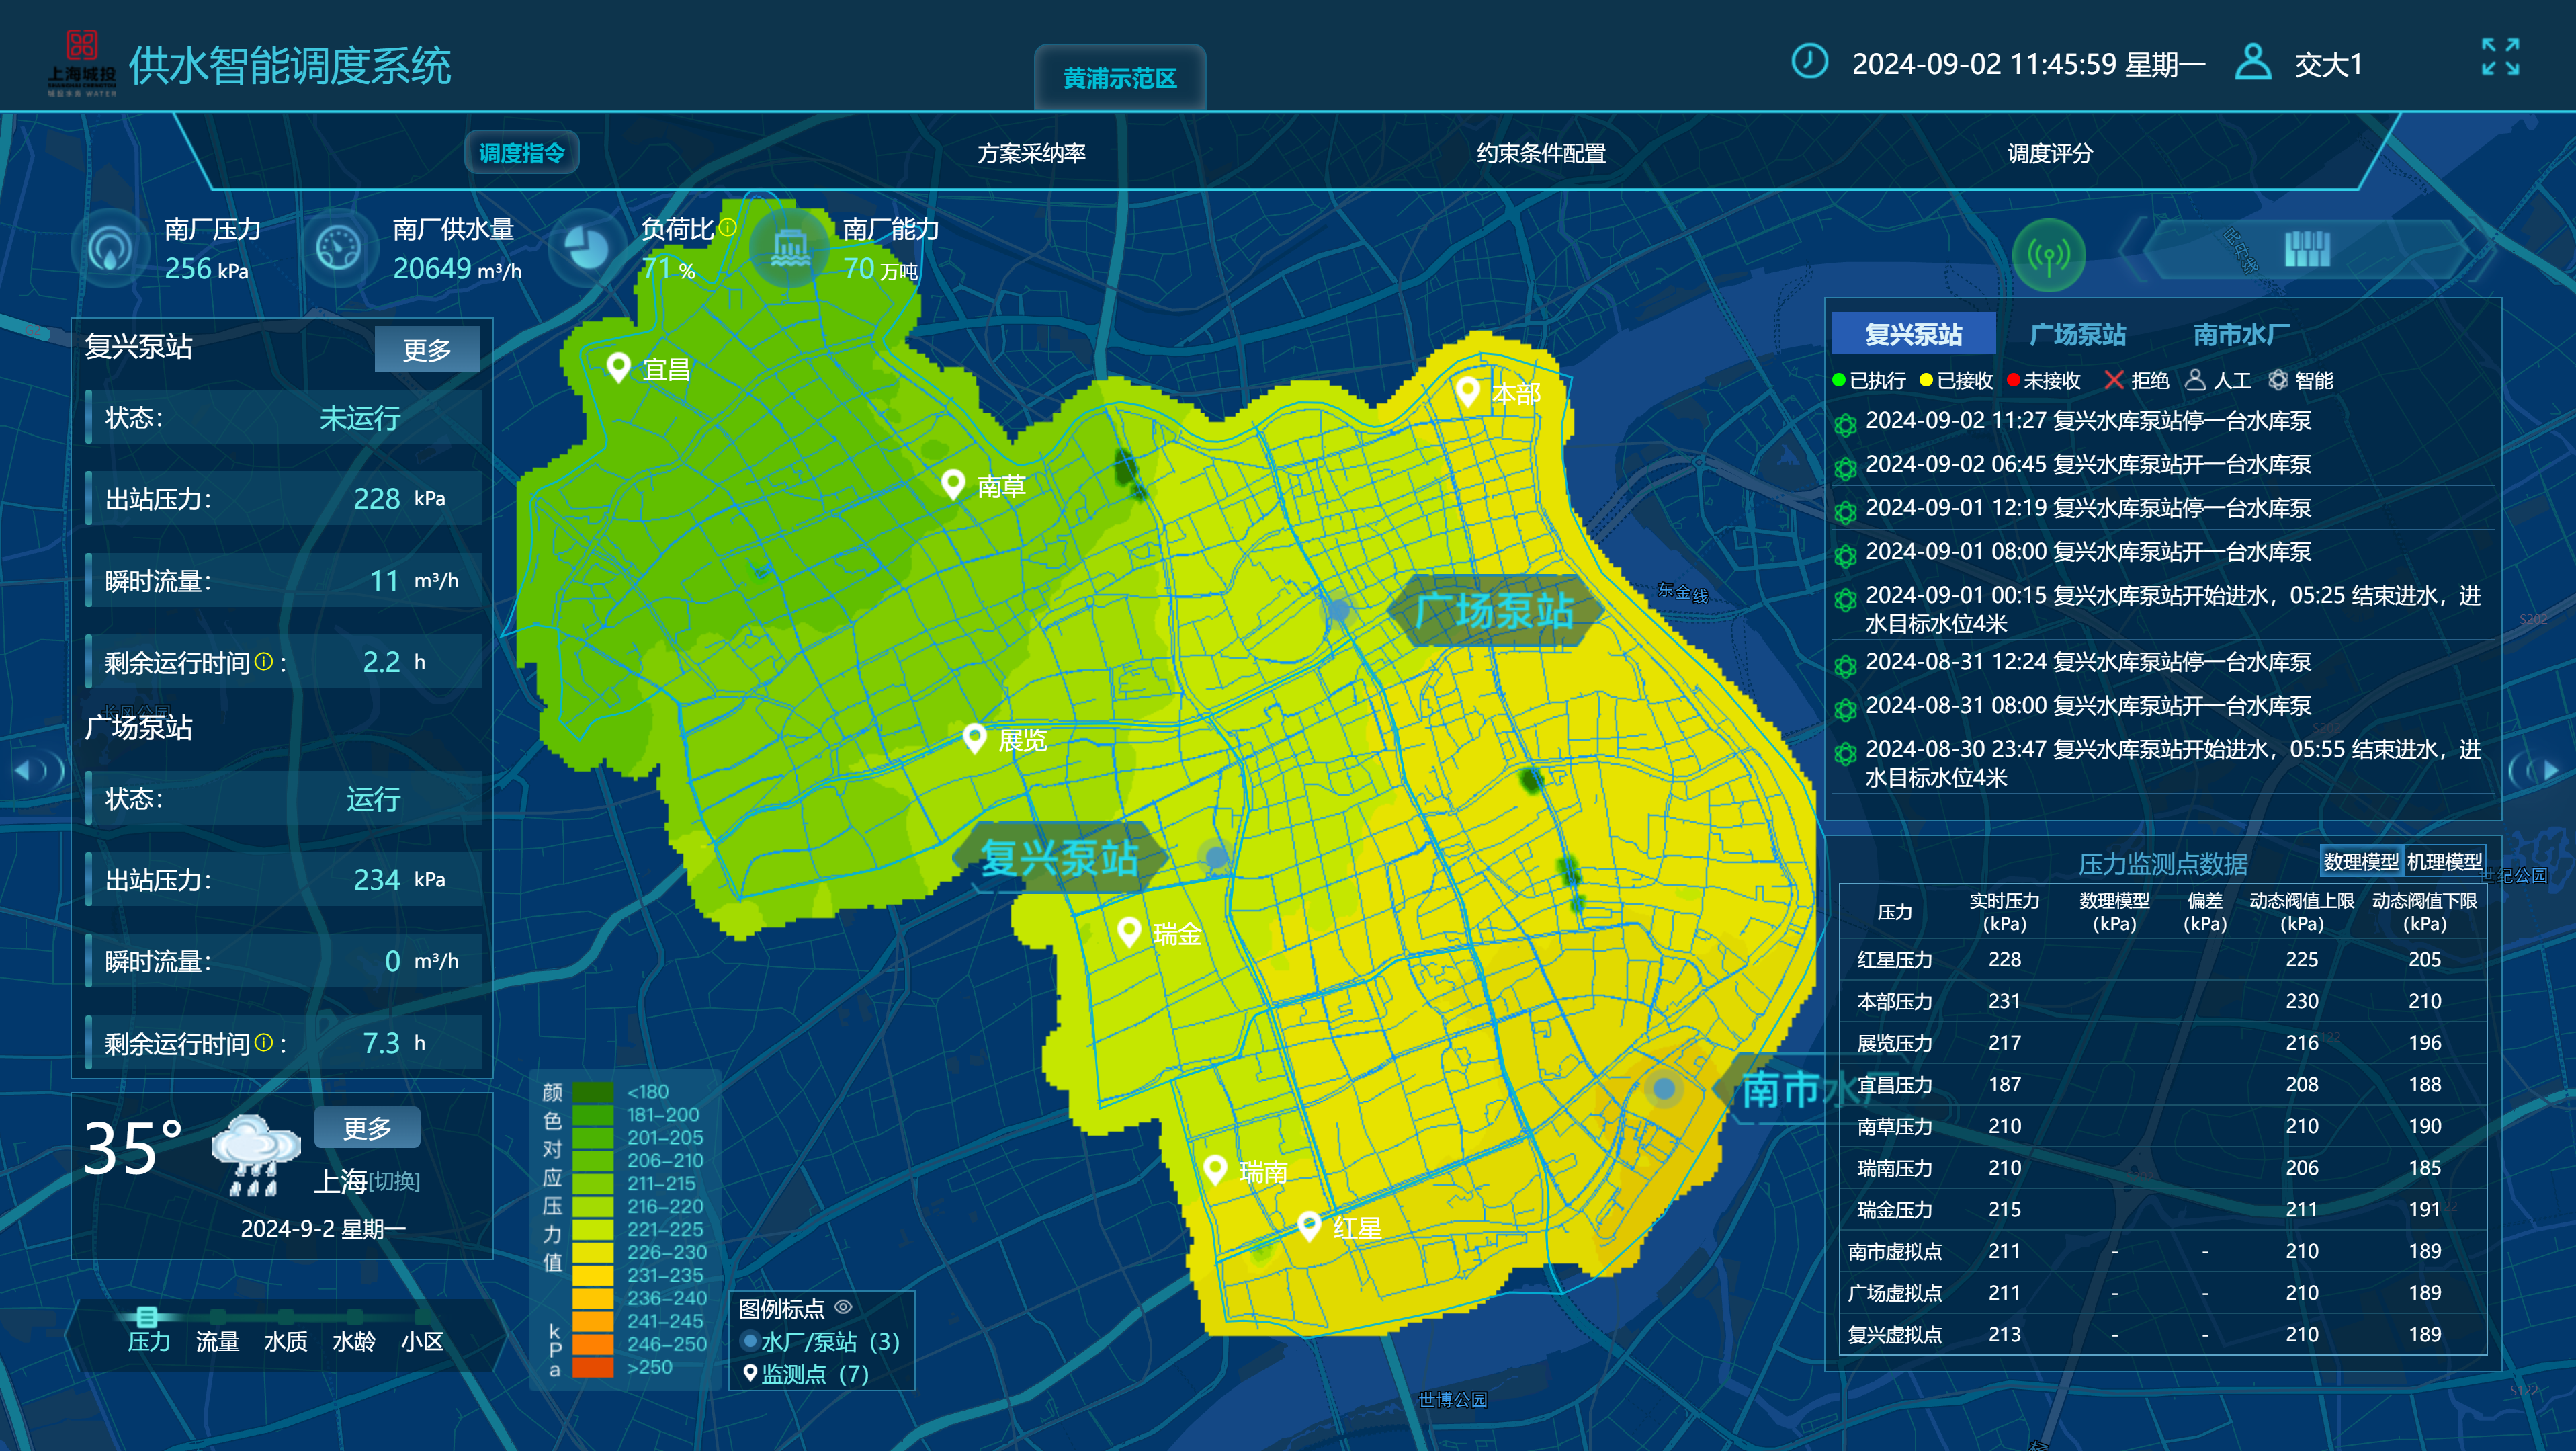
Dashboard for routine planning status, area map, and execution review.
中文图注:运行总览界面,包含区域状态分布与例行记录。
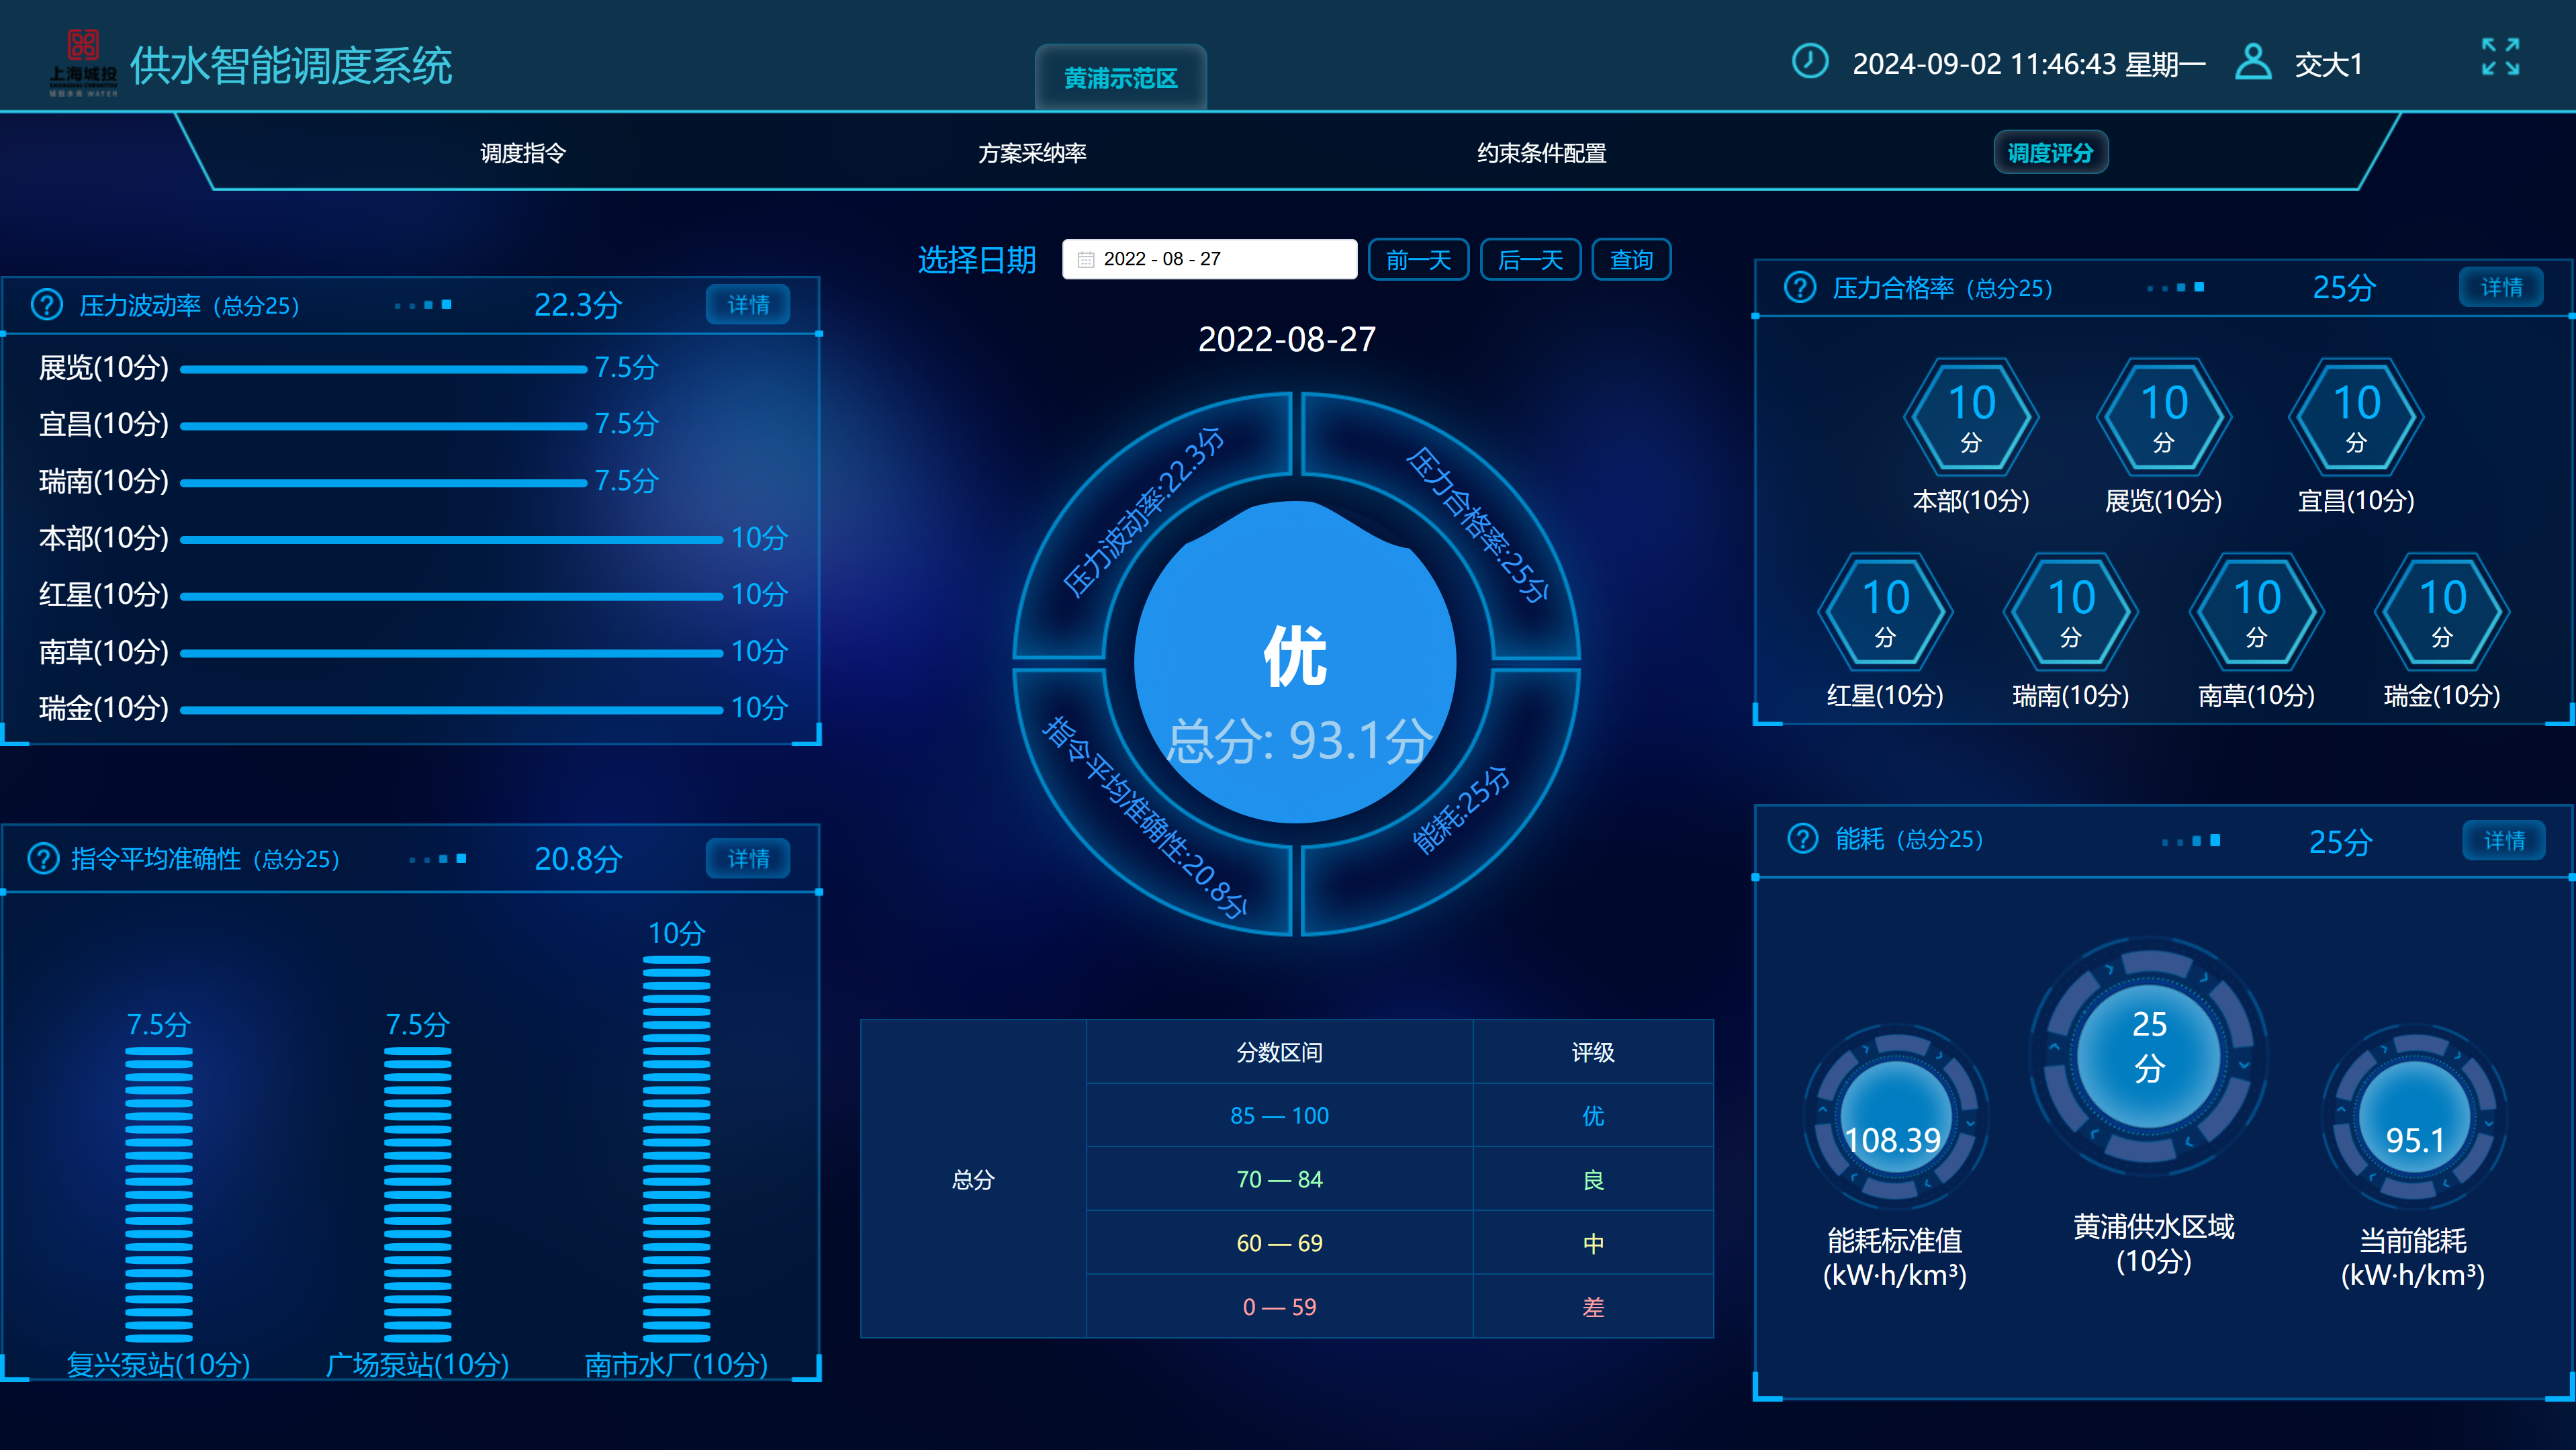
Evaluation panel supporting routine review of plan quality and summary indicators.
中文图注:评估界面,用于查看方案质量与汇总指标。
Observed Outcomes
- Observable quality and efficiency improvements were reported in routine use.
- Better interpretability was supported through dashboard and evaluation modules.
- Reusable templates supported recurring operating patterns.